Tuesday, November 29, 2005
Corporations Squeezing Workers: Profits Vs. Pension Funding
by Tom Bozzo
I'd recently seen a graph in a dead tree copy of The Economist that caught my eye, showing the sharp increase in pension underfunding over the last few years. This includes the more recent years when corporate profits have skyrocketed. I put together this comparison chart of pension funding positions versus profits (the underfunding line's data were in the original Economist graph):
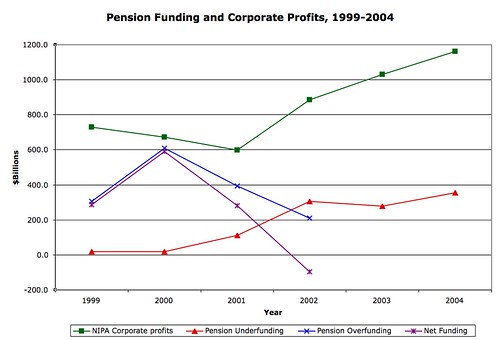
Sources: National Income and Product Accounts Table 6.16D; Pension Benefit Guaranty Corp. press releases (here and here), 2004 Pension Insurance Data Book.
I couldn't locate more recent data on overfunding (2002 is the latest year reported in the most recent PBGC Data Book), which would be interesting — I'll add it if I can find it. Still, it's interesting to see how little the recovery in corporate finances, not to mention generally favorable stock and bond market conditions (*), have translated into a shoring up of insured pension obligations for the subset of underfunded plans.
It looks to me like corporations squeezing their workers and retirees, and the taxpayers who back up the obligations, for the benefit of capital. Is there a good reason I shouldn't think this?
(*) While 2002 was a terrible year for stocks, it was an excellent year for long-term bonds; the net assets of insured plans only declined 5% (~$100 billion) between 2001 and 2002.
One common theme for wage-and-benefit cutters is that previously promised benefits are now unsustainable. This has struck me as a self-serving argument at best. Is it the unionized U.S. auto worker's fault that the marketers have to put a pile of cash on the hood to move a Big Three car that's twice as big as the supposedly crushing health benefits? (A: No.)
I'd recently seen a graph in a dead tree copy of The Economist that caught my eye, showing the sharp increase in pension underfunding over the last few years. This includes the more recent years when corporate profits have skyrocketed. I put together this comparison chart of pension funding positions versus profits (the underfunding line's data were in the original Economist graph):
Sources: National Income and Product Accounts Table 6.16D; Pension Benefit Guaranty Corp. press releases (here and here), 2004 Pension Insurance Data Book.
I couldn't locate more recent data on overfunding (2002 is the latest year reported in the most recent PBGC Data Book), which would be interesting — I'll add it if I can find it. Still, it's interesting to see how little the recovery in corporate finances, not to mention generally favorable stock and bond market conditions (*), have translated into a shoring up of insured pension obligations for the subset of underfunded plans.
It looks to me like corporations squeezing their workers and retirees, and the taxpayers who back up the obligations, for the benefit of capital. Is there a good reason I shouldn't think this?
(*) While 2002 was a terrible year for stocks, it was an excellent year for long-term bonds; the net assets of insured plans only declined 5% (~$100 billion) between 2001 and 2002.
Comments:
<< Home
I'm not sure that GM's corporate profits follows the same trendline you show. Or for that matter Ford or Chrysler. Or the airlines. How much of total pension underfunding is due to these industries specifically? How much of corporate profits is due to these industries specifically?
# posted by  : Tue Nov 29, 11:10:00 PM
: Tue Nov 29, 11:10:00 PM
GM's consolidated net income was $1.7 billion in 2002, $3.8 billion in 2003, and $3.7 billion in 2004. They claimed their pension plans were overfunded by $3 billion in their Q4 2004 earnings release.
Ford had started struggling a bit earlier than GM, but they had been on the SUV gravy train, too. DC has been somewhat healthier lately than the other two.
The airlines' collective shortfall is a few tens of billions of dollars. It should be noted that UAL had notoriously mismanaged some of its funds, and liberally used some ERISA loopholes to avoid committing cash to its plans even in the relatively fat pre-9/11 days.
(There was some good blogging on the subject at Ballon Juice.)
Post a Comment
Ford had started struggling a bit earlier than GM, but they had been on the SUV gravy train, too. DC has been somewhat healthier lately than the other two.
The airlines' collective shortfall is a few tens of billions of dollars. It should be noted that UAL had notoriously mismanaged some of its funds, and liberally used some ERISA loopholes to avoid committing cash to its plans even in the relatively fat pre-9/11 days.
(There was some good blogging on the subject at Ballon Juice.)

<< Home
![]()
