Monday, January 16, 2006
Madison Employment in the "Leisure and Hospitality" Industry
by Tom Bozzo
First, here's a graph with the "leisure and hospitality" employment growth series used in the Chamber's report, along with two more narrowly defined series — each more closely targeted to the bars and taverns that would be expected to bear most of any employment effect from the ban.

(Click the picture for a full-size version.)
An interesting feature is that employment growth for the "leisure and hospitality" sector and the subsets including food service establishments and drinking places diverged before the smoking ban took effect.
Here are the employment data from which the growth rates were calculated.
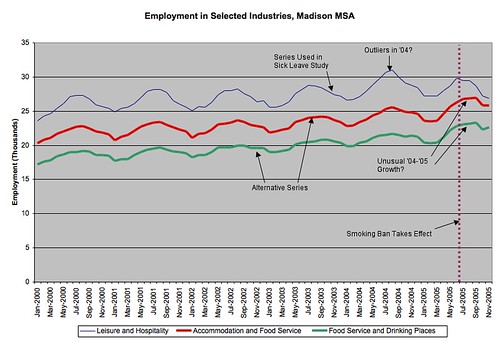
A few things to note. First, the "food service and drinking places" industry accounts for the lion's share of total leisure and hospitality employment. The "leisure and hospitality" aggregate seems to show more pronounced summer peaks than the subgroups. They all appear to have a mild upward trend. The peak in 2004 seems to be unusually high for the aggregate, and the peak in '05 seems high for the "food service and drinking places" series. Meanwhile, "leisure and hospitality" excluding accommodation and food service is unusally low in the fall.
The residual classification is "arts, entertainment, and recreation" (which includes amusement and gambling industries), and I would have to defer to someone with more local labor market expertise to know if there's a story there. I can't think of an obvious source of a contraction in that category in the city, so if there's no story, I'd think... outlying data.
That's not the implication the CoC study wants you to draw, of course.
You should also read Ben at Badger Blues, from whom I was channeling the "hatchet job" theme.
(A spreadsheet with the source graphs, underlying data, and BLS series identifiers is here.)
When last we left the Chamber of Commerce's disgraced hatchet job (get a copy here at Dane101.com) on the proposed Madison sick leave mandate, we had observed that its mostly off-topic section on the employment effects of the Madison smoking ban had failed to use city-specific data and, more importantly, had appeared to have chosen an employment series more for rhetorical effect than relevance. I promised graphs, and here they are.
First, here's a graph with the "leisure and hospitality" employment growth series used in the Chamber's report, along with two more narrowly defined series — each more closely targeted to the bars and taverns that would be expected to bear most of any employment effect from the ban.
(Click the picture for a full-size version.)
An interesting feature is that employment growth for the "leisure and hospitality" sector and the subsets including food service establishments and drinking places diverged before the smoking ban took effect.
Here are the employment data from which the growth rates were calculated.
A few things to note. First, the "food service and drinking places" industry accounts for the lion's share of total leisure and hospitality employment. The "leisure and hospitality" aggregate seems to show more pronounced summer peaks than the subgroups. They all appear to have a mild upward trend. The peak in 2004 seems to be unusually high for the aggregate, and the peak in '05 seems high for the "food service and drinking places" series. Meanwhile, "leisure and hospitality" excluding accommodation and food service is unusally low in the fall.
The residual classification is "arts, entertainment, and recreation" (which includes amusement and gambling industries), and I would have to defer to someone with more local labor market expertise to know if there's a story there. I can't think of an obvious source of a contraction in that category in the city, so if there's no story, I'd think... outlying data.
That's not the implication the CoC study wants you to draw, of course.
You should also read Ben at Badger Blues, from whom I was channeling the "hatchet job" theme.
(A spreadsheet with the source graphs, underlying data, and BLS series identifiers is here.)
![]()
