Friday, September 29, 2006
Fun With Tax Data
by Tom Bozzo
A fair number of the Google hits here appear to be seeking income distribution data, and for a change we won't offer a crushing disappointment to those searchers. "Adjusted Gross Income" for U.S. income tax purposes has its deficiencies as an income measure, but it's right in this here table [.xls] for convenient examination. There's much more at this page.
The basic picture is that after seeing a post-stock market bust turnaround begin in 2003, the top 1% of taxpayers did quite well in '04 — nearly returning to boom levels, in fact. (We can guess what next year's release of '05 data will show.)

The relatively small AGI declines for at the 50th and 75th percentiles reinforces Max's conclusion that the bubble burst was the problem for the rich, more than the recession. As we've noted here before, the masses simply don't have enough financial assets, and by extension capital income, for the bust to make a big dent.
Much of the upward trend in the data, especially at the median and 75th percentile, is inflation. After inflation adjustment there is, not surprisingly, large divergence between the masses and the income elites. This shows the relative changes by percentile since 1986:
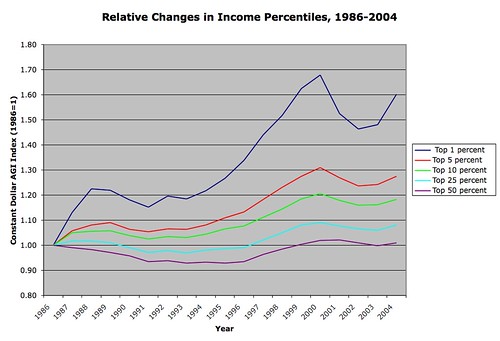
The later-morning in America did nothing to speak of for the lower three-quarters or so of the population, and the late-nineties boom only returned the median-AGI taxpayer to the 1986 level after inflation. Even into the quite-well-to-do (90th percentile taxpayers, say) have not exactly seen rapid real AGI growth on balance. But hey, we have dirt-cheap DVD players!
Max brought the news: the latest tax data tables (from 2004) have been published by the IRS fairy!
A fair number of the Google hits here appear to be seeking income distribution data, and for a change we won't offer a crushing disappointment to those searchers. "Adjusted Gross Income" for U.S. income tax purposes has its deficiencies as an income measure, but it's right in this here table [.xls] for convenient examination. There's much more at this page.
The basic picture is that after seeing a post-stock market bust turnaround begin in 2003, the top 1% of taxpayers did quite well in '04 — nearly returning to boom levels, in fact. (We can guess what next year's release of '05 data will show.)
The relatively small AGI declines for at the 50th and 75th percentiles reinforces Max's conclusion that the bubble burst was the problem for the rich, more than the recession. As we've noted here before, the masses simply don't have enough financial assets, and by extension capital income, for the bust to make a big dent.
Much of the upward trend in the data, especially at the median and 75th percentile, is inflation. After inflation adjustment there is, not surprisingly, large divergence between the masses and the income elites. This shows the relative changes by percentile since 1986:
The later-morning in America did nothing to speak of for the lower three-quarters or so of the population, and the late-nineties boom only returned the median-AGI taxpayer to the 1986 level after inflation. Even into the quite-well-to-do (90th percentile taxpayers, say) have not exactly seen rapid real AGI growth on balance. But hey, we have dirt-cheap DVD players!
![]()
