Wednesday, May 14, 2008
Long-Term Housing
I haven't done any hard searching yet, but after some desultory searching at Zipskinny, one thing stood out.
I was checking, basically, ZIP codes in which I've lived (19119, 47331, 07040, etc.).
At a glance, you can tell that the middle one above is from the Midwest and the other two are East Coast. And, as David Brooks tells me, the soul of the Earth is different. More stable.
So here's my attempt at making a table:
| ZIP Codes | City and State | Stability (same home 5+ years) |
|---|---|---|
| 06880 | Westport, CT | 64.0% |
| 19119 | Philadelphia, PA | 62.4% |
| 44116 | Rocky River, OH | 61.0% |
| 07040 | Maplewood, NJ | 60.0% |
| 45385 | Xenia, OH | 58.8% |
| 47331 | Connersville, IN | 57.5% |
| 46544 | Mishiwaka, IN | 56.7% |
| 43230 | Gahanna, OH | 50.4% |
| 94706 | Albany, CA | 50.1% |
Need to work on those border lines. (UPDATE: Ah, so they just don't show in Preview mode. No idea about all that white space, though.)
Judging by the data—which, as noted is a semi-random sample: ZIP codes in which I've lived, ZIP codes where relatives live, a Place of Legend* to which some old friends moved recently (Westport), and three Ohio cities that are suburbs of Cincinnati (Xenia), Columbus (Gahanna), and Cleveland (Rocky River; h/t Erin for that one being chosen)—it appears that most of those nice, stable Midwestern towns are less stable than the East Coast Dens of Iniquity.
I'll be waiting for David Brooks to apologize for every column he's written in the past eight years. Expect that will happen about the time he accepts one of those offers to actually provide accurate statistical analysis to him.
*Fortunately, since this is a family blog, the phrase "doing Westport" is not defined at The Usual Sources.
Labels: Housing Bubble, Statistics


Monday, May 12, 2008
It took 11 Hours for Someone to Point out the Obvious
Is Zubin Jelveh one of the economists advising Hillary Clinton, or was Tyler Cowen just giving him a pass?
If you're a married woman living in the New York City area, there's a better than 50 percent chance that you don't work, according to a recent analysis of Census data by economists affiliated with the St. Louis Federal Reserve Bank.
More specifically, only 49 percent of white high school-educated married women in their prime working ages were holding down jobs in the New York area as of the 2000 Census.
It was not until 6:04p.m.—eleven hours later—that "Cardinal Fang" noted:
What, so now only white women count as women?
Posted by: Cardinal Fang at May 9, 2008 6:04:19 PM
while Andrew Samwick perpetuates the meme.
I would have hoped that Felix would apologize that one of Portfolio's reporters swallowed this one whole, but it's been three days.
Labels: Economics, Statistics
Thursday, March 20, 2008
Something I Need to go through More Carefully
A marvelous post from Andrew at Statistical Modeling etc. which evolves in the comments into a discussion of Willingness to Pay (WTP) vs. QALYs.
For some reason, economists seems to prefer the former to the latter. Which is strange, because it is intuitively easier to build a realistic Health Economics model using QALYs and treating insurance premia as an investment than the current standard of treating insurance premia as a "sunk cost" and declaring Moral Hazard at all turns.
Labels: Economics, Health Care, QALYs, Statistics
Tuesday, February 12, 2008
Marshall Jevons confirms part of my suspicion
If I weren't still buried in health data, with a side trip to MLB, one of the things I wanted to work out was whether the current "Small Government Republican" administration would have positive job growth without its additions of government jobs.
(For context, it was common belief among my cohorts in the Government Practice at PwC that government employment would decline by about 30% in the next 20 years. Since that was ca. 2001, we're more than 1/3 of the way there.)
Fortunately, Marshall Jevons presents the evidence graphically. What might have been expected to be a 7-10% decline is nowhere to be found.
So not only are they pouring sand in the gas tank, they are adding to the weight of the car. And heavier cars, as any physicist or Stata user can tell you, get lower performance.
Labels: full employment, governance, Republicans, Statistics
Sunday, February 10, 2008
Is Freakonomics Economics for those who cannot understand Statistics?
Via ESPN came the claim that some Penn professors "refute[d]" the report that Roger Clemens's late-career performance for the past decade was not unique.
This gets us to the Freakonomics blog, with a guest post from Justin Wolfers, which gives credence to Daniel Davies description of the book's central conceit:
So, for example, sumo wrestlers are "cheating" because wrestlers who need to win a bout to stay in the top league do statistically significantly better when fighting wrestlers for whom the match is a dead rubber. Not "taking sensible steps to minimise the risk of injury". Not "following unwritten social conventions of the sport". Not anything else, but "cheating", and most likely doing so because of bribery and corruption from betting syndicates.
Why do I have such a reaction? From Wolfers say in his guest post:
There’s a pretty neat trick at work [in the report from Clemens's attorneys]: if you compare Clemens only to those who had a terrific last decade of their careers, then the last decade of Clemens’ career doesn’t look that unusual....
So we put together data on all 31 other pitchers since 1968 who started at least 10 games in at least 15 seasons and have pitched at least 3,000 innings...
To be clear, we don’t know whether Roger Clemens took steroids or not. But to argue that somehow the statistical record proves that he didn’t is simply dishonest, incompetent, or both. If anything, the very same data presented in the report — if analyzed properly — tends to suggest an unusual reversal of fortune for Clemens at around age 36 or 37, which is when the Mitchell Report suggests that, well, something funny was going on. [emphases mine]
and, from the NYT
Other measures suggest Clemens performed similarly to his contemporaries. But these comparisons do not provide evidence of his innocence; they simply fail to provide evidence of his guilt.
and ends by giving the lie to their own lie:
Statistics provide powerful tools for understanding the world around us, but the value of any analysis invariably comes down to choosing a useful statistic and an appropriate comparison group. Statisticians-for-hire have a tendency to choose comparison groups that support their clients. A careful analysis, and a better informed public, are the best defense against such smoke and mirrors. [again, emphases mine]
You would think, from this, that the evidence presented by the Penn professors and Mr. Wolfers would be somehow sacrosanct, a Holy Grail, a definitive "smackdown" to make Brad DeLong proud.
Instead, we get "all 31 other pitchers since 1968 who started at least 10 games in at least 15 seasons, and pitched at least 3,000 innings." Now, some of these are Hall of Famers: Dennis Eckersley but maybe not Steve Carlton (career began in 1965), and if Carlton, then Doyle Alexander, Charlie Hough, Milt Pappas, Joe Niekro, Chuck Finley, Danny Darwin, Mike Mussina, and Jamie Moyer, to name a few from this site.
In short, most of those 31 pitchers aren't people whose career, up until the age of 33, compares to Clemens. Which is why—not to put too fine a point on it—the Wolfers graphic for walks and hits per innings pitched looks more like an Edgeworth Box than a statistical analysis.
The authors are careful not to name the pitchers in their sample. But they are perfectly willing to cast aspersions on the sample that named pitchers, since the pitchers named—Ryan, Randy Johnson—are generally presumed above suspicion and have early careers rather closer to Clemens's than the Charlie Houghs and Danny Darwins and Jamie Moyers ever were.
So the "statisticians" managed to show that Clemens's final decade is an outlier. But their own graphics shows that Clemens's career is an outlier from their smoothed data. You might think from this that they would know that their comparison was rather suspect.
From their text, they clearly knew it. Also from their text, they didn't and don't care. They got to cast aspersions, got published in the NYT, got pushed on ESPN, and got a nice writeup on the Freakonomics blog.
Let's look at their last sentence again:
A careful analysis, and a better informed public, are the best defense against such smoke and mirrors.
That would be nice. I wonder: do the authors intend to do one?
Labels: baseball, Economics, Journamalism, Statistics
Sunday, January 13, 2008
Everything I Know about Statistics, and Probably Economics, is Wrong
Via
By 1996 the percentage willing to vote for a black candidate reached 93 percent, so close to unanimity that the survey dropped the question.
Labels: analytics, Economics, Journamalism, Statistics
Thursday, December 20, 2007
The Perfect Gift for a Certain New Aunt
Via the Social Science Statistics Blog, a flyswatter for the happy Milanophile.
As a bonus, the same post leads to (and features a picture of) a graphic-laden representation of What Georgie Wanted the US Budget to Be.
Which, given my recent obsession, leads to the obvious question (zoom in on the penny in the lower right corner): If "the cost growth per beneficiary in the Medicare and Medicaid programs has tracked cost trends in private-sector health-care markets" (h/t DeLong; the original is WSJ subscriber-only, though it was probably Digged), why was the Medicare budget only projected for a 5% (nominal) increase? Or does that question answer itself?
Labels: Brad DeLong, Bushonomics, Econometrics, Economists View, Health Care, Janelle, Politics, Statistics
Wednesday, September 05, 2007
Some Elementary Analytics for the Surge
We picked up a link a few days ago from an unlikely source, the Protein Wisdom Pub. In a post that, among other things, describes our quals based on the political content of the blogroll ("fairly left-leaning"), it's asserted that "statistics comparing 2006 with 2007" deployed by major figures of the left blogiverse such as Kevin Drum and Matthew of Large Media, "[tell] us nothing about the success of the new US counter-insurgency strategy" because the surge "did not have any implementation before mid-February." The preferred analysis claims a downward turn to the civilian casualty trend line (eyeballed or the equvalent from seasonally unadjusted and otherwise tweaked icasualties.org data) since the start of the surge, and does so by comparing data from this summer with the winter and/or spring.
Now, I'm no Jim Hamilton, but I can say with reasonable authority that the claim that year-over-year comparisons of data from Iraq are necessarily uninformative is all wet. Indeed, such comparisons are a simple way of eliminating some seasonal effects from data. With a simple model of data generation (e.g., the seasonal effects are additive), you can verify by simple algebra that a year-over-year difference will eliminate the seasonal factor [*], whereas intra-year comparisons and comparisons between different periods in different years will tend to confound seasonal and trend effects.
So, for the intrayear comparisons to be (relatively) valid as an indicator of trend reversal, it must be either that the seasonal effects are small, or that they just so happen to cancel out. Indeed, PW Pub's Karl argues that the effects are small, in part based on analysis at the econoblog Creative Destruction, which ran a seasonal adjustment model on the fatality data for the U.S. forces.
The results at Creative Destruction, which yield a seasonally adjusted 101 U.S. military deaths for July 2007 from the actual 79, aren't actually helpful to the trend reversal argument. Apart from a peak in May, seasonally adjusted casualties suggest a plateau at a rate of around 100 deaths/month for the surge through July (the analysis was posted on August 2), which is very high for any extended period. As I'd noted previously, while there's a lot of variation in the data, it's clear without any special quantitative analysis that the summer months are never the annual peak.
However, there is a bit more to the argument out of Wingnuttia that perhaps merits some additional discussion. It's suggested that year-over-year comparisons confound an effect of the surge with that of an increase in violence against civilians which is dated to the February '06 bombing of the Golden Mosque in Samarra, even though the real takeoff in the data (from icasualties.org) isn't until the fall of '06. The implication that civilian life in Iraq was just hunky-dory in 2004-2005 is questionable at best, though I wouldn't dispute a claim that the the SNAFU has acquired more CF since. [**]
The argument is that if you think things are bad now, imagine how much worse they'd be but for the surge. That's not exactly a narrative of triumph, considering the difficulty of maintaining the surge, let alone any further escalation of a magnitude that might be thought to be able to restore the status quo ante.
Worse still, the supposed reversion in the civilian fatality trend is, itself, showing signs of reverting in the bad direction. The count at icasualties.org, after dropping from 1,782 in May to 1,148 in June, increased sequentially in July and August — 1,458 and 1,598, respectively. The latter, in particular, is at the level of the civilian casualty peak or plateau (using data that are adjusted as described, in part, here) from the pre-surge months.
So, really, there's sod all to show for the surge. Coalition military fatalities are high, Iraqi civilian fatalities are high, and by many other metrics Iraq remains an unholy mess. All this at a cost to the U.S. taxpayer of several tens of billions of dollars at an annual rate. Who wouldn't want more surge? [/sarcasm]
The last thing is about the adjustments to the civilian casualty data, which remove a few peaks from the raw icasualties.org data. In one case, the adjustment is ostensibly justified, as it eliminates the effects of a temporary change in the count methodology [***]. In another, the rationale is, to say the least, curious. "Engram" deletes the 965 deaths in August of '05 from the Al-A'imma bridge stampede because:
Those tragic deaths were clearly an aberration and should not be included in a graph that tries to assess trends in the level of violence in Iraq.The reported cause of the stampede was a rumor that a suicide bomber was amid the crowd, which had been subjected to mortar attacks earlier in the day. So this is hardly a non-terrorism-related incident, even if the spread of the rumor wasn't itself an act of terrorism. The irony is that Engram is a member of the Althousian 9/11-changed-everything set:
Pre-9/11, I was a politically incurious liberal, but my curiosity increased substantially -- and my views changed considerably -- after 9/11.By the same logic, if you're trying to assess trends in the level of violence in the U.S., the tragic deaths of 9/11 are clearly an aberration. So what the hell are we doing there?
[*] This assumes the seasonal component enters additively in the current and previous-year data. More sophisticated seasonal adjustment approaches allow for situations such as seasonal effects that vary over time.
[**] The subsequent discussion ignores the significant obstacles to reliably measuring the consequences of the war for the civilian population; the icasualties.org data is an incomplete and unverified tabulation from news accounts
[***] For some purposes, it actually can be better to have data that are wrong in a consistent way.
Labels: Iraq, Statistics, Wingnuttia
Thursday, August 16, 2007
Chris Dillow Explains It All to You
Too good not to quote:
There's one very stupid way of doing this. Imagine you're a chicken. Every day, the farmer feeds you. After a while, you figure: "My returns from the farmer are pretty stable, as I seem to get roughly the same amount of corn every day. Being a chicken is a low-risk business."
The following day, the farmer breaks your neck.
Read the Whole Thing. After that, consider that Henry Paulson leaving his old job for his current one made both places worse.
Labels: High Finance, Optimal Resources, Statistics, subprime
Wednesday, August 01, 2007
Seasonality in Iraq War Causalties?
Robert Farley notes at LGM that the lower U.S. death toll in Iraq for July — 78 as of this morning, at icasualties.org — is being touted as the "year's lowest." Go surge?! In the NYT:
On July 26, Lt. Gen. Raymond T. Odierno, the second-ranking American commander in Iraq, said that the lower death toll was a “positive sign” but that it was too early to say whether the reduction was a “true trend.”Farley makes the needed 'one observation (probably) does not a trend make' comment, and raises the possibility of seasonality in the data. Here's a graph of the icasualties.org tallies by month (for the whole coalition, not just the U.S.):
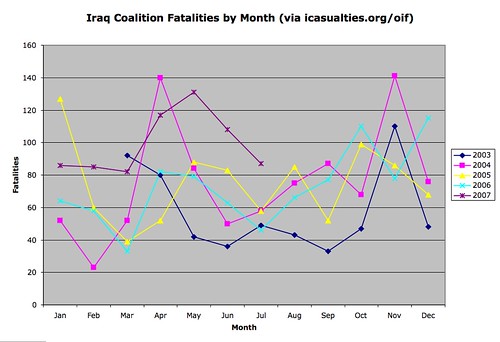
A few observations on top of Farley's:
- They forgot about Poland: The figure for total coalition casualties for the month (87) is a less-newsworthy fourth-best for the year.
- So far, 2007 looks like 2006, shifted up.
- The July fatality rate (2.81/day) remains above the 2.48/day average for the entire ordeal.
- If someone's popping corks over 78 deaths a month, when the figure has been less than half that as recently as March 2006 (a long time ago, actually), then success clearly is being defined down.
- The seasonality picture is a bit hard to eyeball (unlike, say, the pattern of natural gas usage at my house), though it's pretty uniformly the case that the summer months are never the annual peak. Taking past years as a guide, I'd bet on at least one month to come this year that's considerably worse than the summer trough.
- Like Farley, I'd guess that the non-summer peaks aren't random, though I think it's a matter for future military historians more than X-12 ARIMA to describe the considerations behind the timing of the operational (and hence casualty) peaks.
Labels: Iraq, Statistics
Thursday, July 19, 2007
Oh Joy, Another 'Copernican Principle' Post
As a follow-up from the earlier post on the topic, in the Crooked Timber thread following Quiggin's post, commenter RB points to a letter to Nature's editor from 1994 by Johns Hopkins biostatistician Steven Goodman making the case that Gott's reasoning is an example of an old statistical fallacy. (Goodman posted it as a comment to Tierney's NYT blog.) Goodman's general thrust — 'lies, damn lies, statistics' — is correct, but he maybe goes a bit too far in deploying the f-word.
Simply put, the principle of indifference [i.e., the fallacy] says that it you know nothing about a specified number of possible outcomes, you can assign them equal probability. This is exactly what Dr. Gott does when he assigns a probability of 2.5% to each of the 40 segments of a hypothetical lifetime. There are many problems with this seductively simple logic. The most fundamental one is that, as Keynes said, this procedure creates knowledge (specific probability statements) out of complete ignorance.Actually, there is a more charitable version than this, which is how I'd previously set up the problem, and how Monton and Kierland characterize Gott's original argument. In my account, the uniform distribution of the observation point is explicitly part of the (assumed) information set; I've packed my free lunch as it were. If that doesn't sound like much, it's not. However, I would submit that the more useful thing to argue over is whether the uniform distribution assumption is warranted. As it happens, I said before that the assumption is strong before, and what I mean is that in practice it seems unwarranted for the array of amusing social applications that Gott can't seem to resist.
But for a little more damnation by faint praise, let's just remember what's being promised by the method: a prediction within a factor of 39 of the start-to-present interval. As a practical matter, the real problem in many cases is not that too much fabricated information is being brought to bear, especially at the upper bound.
Labels: Philosophy, Science, Social Science, Statistics
Not Necessarily the Doomsday Clock
Just going to show what happens when you drop off even the post-paywall NYT op-ed page, reaction to John Tierney's report that we have 46 years to colonize Mars Or Else Civilization is Dooooomed has been relatively muted over the Intertubes. Prof. Bainbridge quotes the Ole Perfesser without comment (see Roy at Alicublog for the omitted analysis) but also Charlie Stross's excellent post on the grim case for space colonization.
So how do you get that 46 years?
Suppose you're observing an Event that occurs during a fixed time interval (potentially a strong assumption). Suppose also that Baldrick is flying your space-time conveyance and drops you at a random point in the interval (potentially a very strong assumption). Suppose third that you know nothing else about the event. Your "best guess" as to where you've landed, in the expected value sense, is the midpoint of the interval. So if you then get your bearings and figure out how long ago the event started, which is all the information you have, your best guess is that the event will end the same amount of time in the future. That isn't a very good guess, though, in the sense that there's a 50% chance that the "true" end will be sooner or later than that.
Applied to the human spaceflight program, dated to 1961 (questionable [*]), then by advanced mathematics about 46 years have elapsed since then and the information you have and the assumptions above lead to the result. QED.
What the astrophysicist J. Richard Gott did, in a short paper, was to construct interval estimates with high confidence levels -- statements that the unknown end date for the event should fall between A and B 95 percent of the time. For the spaceflight case, A is 2008 (next year) and B is AD 3,801. But saying that you're 97.5 percent confident that the human spaceflight program will end in the next 1,800 years or so doesn't have the same sense of urgency. More generally, 95 percent confidence results in a range from 1/39th the age of the event on the low side to 39 times the age of the event on the high side. Call this the "Copernican formula" if you will. The proof methodology (see this paper [PDF], helpfully linked by Tierney) uses only undergraduate-level mathematical statistics, so read it yourself if you're so inclined.
This leads me to strongly endorse John Quiggin's conclusion:
The real lesson from Bayesian inference is that, with little or no sample data, even limited prior information will have a big influence on the posterior distribution. That is, if you are dealing with the kinds of cases Gott is talking about, you’re better off thinking about the problem than relying on an almost valueless statistical inference.Indeed, if observing the passage of a year and nothing else, the upper bound of the interval moves out 39 years. That can be a big deal in many applied circumstances! For example, here's Gott himself writing in the New Scientist in 1997. A subhead of "Living proof" suggests he isn't engaged in deliberate leg-pulling as he recounts:
As another test, I used my formula on the day my "Nature" paper was published to predict the future longevities of the 44 Broadway and off-Broadway plays and musicals then running in New York; 36 have now closed - all in agreement with the predictions. The "Will Rogers Follies", which had been open for 757 days, closed after another 101 days, and the "Kiss of the Spider Woman", open for 24 days, closed after another 765 days. In each case the future longevity was within a factor of 39 of the past longevity, as predicted.In this application, a prediction within a factor of 39 of past longevity conceivably covers the range from total flops to huge hits to productions that will eventually be performed by automata in Wisconsin Dells. The "prediction" for the "Will Rogers Follies" is that it will (likely) close within the next 82 years. That's out on a limb. (And certain philosophers inclined to bash social scientists for theories with weak predictive value might put this in their pipe and smoke it.)
Reinforcing Quiggins's point on how posterior distributions may be influenced, had Gott's paper appeared a week earlier, he'd have missed on "Kiss" to the tune of 100 days, since the previous week of running time adds some 9 months to the prediction's upper bound. If it matters whether the production runs another week or another year, searching for information is not unlikely to be rewarded.
Meanwhile, if you wanted to make some inference on whether both "Kiss" and "Will" would be playing at some future date, forget about it. The most interesting contribution comes from Brian Weatherson (at CT and Thoughts, Arguments, and Rants), who derives a neat result showing that if you infer the probability of both plays running at a future date based solely on the length of time they've run together (the information the method admits), it follows that if "Kiss" (the shorter-duration event) is still playing at that date, then "Will" (the longer-running event) will also be playing with probability 1. Weatherson concludes that there must be "something deeply mistaken with the Copernican formula."
My own little gloss, pending peer review in the self-correcting blogithingy, is here in the CT comments. What seems to be happening in this case is that (1) Gott's method throws away the information on how long "Will" has been running, and (2) sneaks in an additional assumption that the "Kiss" and "Will" events must be dependent or correlated. There may be circumstances under which these extremely strong assumptions may be justified, Weatherson maybe goes a bit too far in suggesting that these but they strike me as implying more than diffuse information on anything other than the elapsed times of the events.
Last, since you are by definition still with me here in the unlikely event you are reading this, here's the brief rant portion of the post: How the frack did Gott get 5 frackin' pages in Nature for this, which looks a lot more like it merits a paragraph of Mathematical News of the Weird?! I've been turned down cold — not even this 'reject and resubmit' stuff Drek writes about for stuff a hundred times harder and at least somewhat more relevant, if I don't say so myself. (If you really have time to kill, you may note that part of what I'm talking about eventually came out via other researchers' efforts as part of this IIASA working paper a few years later.) And if that's happened to me, then so too must everyone except Nick Bostrom, as I infer from Tom's Anti-Copernican Principle. W. T. F.
And BTW, Nature, what's up with US$30 for an e-print? Surely the revenue-maximizing price — which given the approximately $0 marginal cost, is also profit-maximizing — is not set at levels that make the likes of me think about sending junior staff to the library (were there a business case for actually obtaining the paper). Just saying.
[/rant]
[*] It's not like Yuri Gagarin's rocket just materialized on the pad and blasted off. And remember, going back even a few years into the preflight stages of human space programs puts a century or two on the upper bound.
Labels: Philosophy, Science, Social Science, Statistics
Friday, June 22, 2007
The Death of Significance?
At Decision Science News (another h/t to Brad DeLong), Dan Goldstein prints a comment from J. Scott Armstrong who has "concluded that tests of statistical significance should never be used." [Emphasis mine.] He is not conducting statistical performance art, and I substantially agree with the conclusion. A couple random remarks:
- There are results which lead to a conclusion that social science researchers tend to tweak their statistical models to cross significance thresholds so they can produce positive results with (presumably) greater probability of publication. But,
- To do so invalidates the published inferences. Because,
- The "classical" statistics reported by most software packages are invalid under any pretesting (i.e., deciding on a model specification based on results from preliminary estimation). And,
- The prospects for computing or simulating correct statistics are as good as the quality of the researcher's choice trail. But,
- A lot of social science "theories" don't determine the full set of explanatory variables, making the lure of statistical model diagnostics attractive. Though,
- There are families of models (e.g., the 'flexible functional form' cost models in economics, which I work with) where individual coefficients have no theoretical interpretation, in which case the researcher has no direct basis for evaluating the consequences of a restriction. More broadly,
- Properties of social science data often mean we need to use consistent but inefficient estimators; sometimes "better" significance from inappropriate estimation methods has little if any meaning. (*) Last,
- Some researchers (not least many who publish empirical results in top economics journals) tend to focus excessively on statistical significance to the detriment of more interesting discussions of the non-statistical significance of their results. (Views differ.)
Authors... instead... should report on effect sizes, confidence intervals, replications/extensions, and meta-analyses.For those of you with institutional access, links to the International Journal of Forecasting article are at the Decision Science News link.
(Cross-posted at Total Drek.)
(*) This sometimes leads to wacky advice being given to everyday applied researchers from econo- or sociometricians, of the "if a result from an inconsistent esitmator goes away with a consistent (but inefficient) procedure, be suspicious [or vice-versa]." Armstrong's bottom-line recommendations address the reasonable suspicions that might arise.
Labels: Econometrics, Economics, Social Science, Statistics


