Monday, January 02, 2006
How Long Will Low Stock Market Returns Persist?
by Tom Bozzo
One year of suckitude.
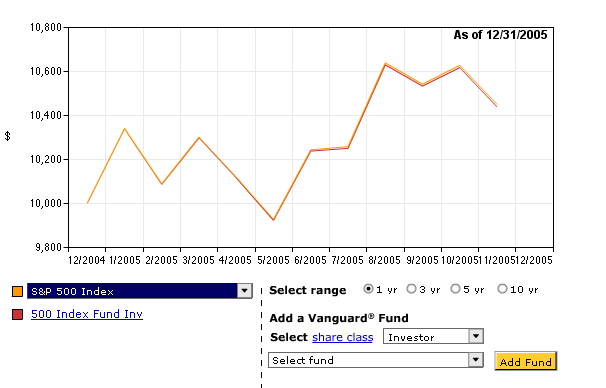
In fact, the last year's paltry returns on large-capitalization stocks are nothing new. The five-year average annual return on the Vanguard S&P 500 Index Fund is 0.42% — negative in inflation-adjusted terms — and the six-year average is worse. So the ten-year average of 9% (around 6% over inflation) is an average of the last four years of the Clinton-era boom and the subsequent six years of (mostly) Bush-era nothing. If the middling predictions floating about for 2006 come true, the 10-year average will take another drop as a boom year falls out of the calculation; since 1997 saw a 33% total return for the S&P 500, 2007 has to be gangbusters or it will fall more.
In that regard, I have to consider Brad DeLong's analysis of where Shiller went wrong in projecting a decade of low returns on the S&P 500 for the decade from 1996 (which led, among other things, to Greenspan's "irrational exuberance" utterance) to be premature. Among other things, a couple years ago bond returns had caught up with stocks, and bond investors willing to stomach the risk of long duration or low quality bonds haven't lagged stocks that much over the entire period, as the graph below shows.
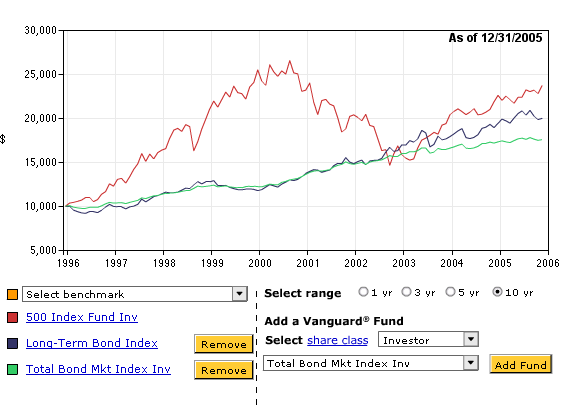
There certainly is a cautionary lesson in that the market need not turn at a rational turning point. Shiller, loosely put, failed to predict the extent of the subsequent irrational exuberance. However, six years of zero nominal returns goes a not inconsiderable part of the way to proving Shiller right in the broader sense that long-term investors may be paid out after a period of high returns unexplained by fundamentals.
I'm not saying that the market won't be up 50% by the end of 2007, which it must be to maintain a 9% average nominal return by that time, but let's just say I'm not counting on it.
I can only imagine that the Bushies thought that, after a couple years' recovery from the 2000-2002 stock market bust, that the public was a little more primed to put the base chunk of its retirement income at risk than they turned out to be. It probably didn't help that the stock market spent much of the year in the doldrums, and only a somewhat perverse rally coinciding with the weather/energy shocks pushed the S&P 500 into the territory of its meager 1%-or-so return over (measured) inflation.
One year of suckitude.
In fact, the last year's paltry returns on large-capitalization stocks are nothing new. The five-year average annual return on the Vanguard S&P 500 Index Fund is 0.42% — negative in inflation-adjusted terms — and the six-year average is worse. So the ten-year average of 9% (around 6% over inflation) is an average of the last four years of the Clinton-era boom and the subsequent six years of (mostly) Bush-era nothing. If the middling predictions floating about for 2006 come true, the 10-year average will take another drop as a boom year falls out of the calculation; since 1997 saw a 33% total return for the S&P 500, 2007 has to be gangbusters or it will fall more.
In that regard, I have to consider Brad DeLong's analysis of where Shiller went wrong in projecting a decade of low returns on the S&P 500 for the decade from 1996 (which led, among other things, to Greenspan's "irrational exuberance" utterance) to be premature. Among other things, a couple years ago bond returns had caught up with stocks, and bond investors willing to stomach the risk of long duration or low quality bonds haven't lagged stocks that much over the entire period, as the graph below shows.
There certainly is a cautionary lesson in that the market need not turn at a rational turning point. Shiller, loosely put, failed to predict the extent of the subsequent irrational exuberance. However, six years of zero nominal returns goes a not inconsiderable part of the way to proving Shiller right in the broader sense that long-term investors may be paid out after a period of high returns unexplained by fundamentals.
I'm not saying that the market won't be up 50% by the end of 2007, which it must be to maintain a 9% average nominal return by that time, but let's just say I'm not counting on it.
Comments:
<< Home
Hey, cool! I always use Vanguard's fund returns too. I hate it when people talk about the Dow. Or they show charts without dividends reinvested. That's why Vanguard's total return charts are nice. Morningstar also has total return charts but you can't combine them. Also, I'm more interested in returns that investors can actually earn rather than market statistics.
Now that Total Stock Market is around it's a better measure (and investment) than the 500.
Some trivia: Vanguard's TBM fund made some bets in 2002 and lost, so it underperformed the index for a while. You could use Intermediate-Term Bond Index, but it excludes GNMA.
Now that Total Stock Market is around it's a better measure (and investment) than the 500.
Some trivia: Vanguard's TBM fund made some bets in 2002 and lost, so it underperformed the index for a while. You could use Intermediate-Term Bond Index, but it excludes GNMA.
# posted by  : Tue Jan 03, 12:17:00 PM
: Tue Jan 03, 12:17:00 PM
Forgot to mention: terrific post! I think Brad was missing the obvious on that one. Or he's tilting hard on small-caps
# posted by : Tue Jan 03, 12:21:00 PM
: Tue Jan 03, 12:21:00 PM
Thanks, anonymous. IIRC the Shiller research Brad referenced was on the 500, which is why I used it instead of TSM. Otherwise, I agree that TSM would better represent total returns for the U.S. stock markets generally. (The extra percentage point of return wouldn't have changed my qualitative assessment of '05 significantly.)
Post a Comment

<< Home
![]()
